|
The Cluster Collaboration
Project
Technical
|
Empirical Isochrones and the R-C gap
Firstly in Mayne et
al (2007) we present many photometric catalogues which we make
freely available. To aid navigation we present a table of all the
photometry available here.
Secondly a version with high resolution figures (as an alternative to the one on astro-ph) is available here.
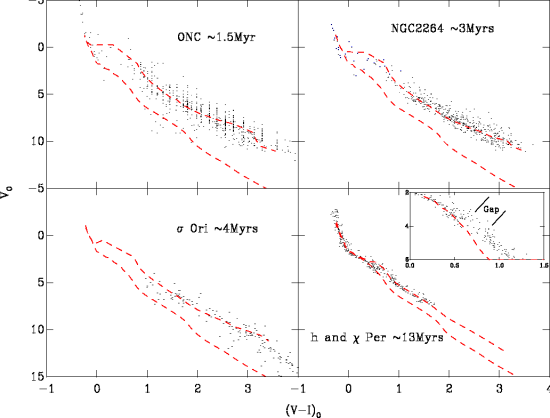
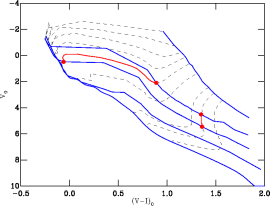
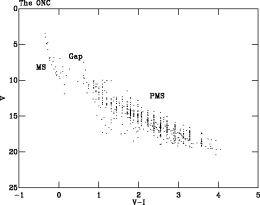
In Mayne et al (2007) we create empirical isochrones by selecting members from a collection of OB associations, clusters, groups and sub-groups (all termed clusters from hereon). Then we fit a cubic spline through these members using a median binning procedure to follow the sequence locus. Once we have created the empirical isochrones we compare the sequences on a relative age plot. To do this we must adjust the sequences to absolute magnitude and colour, using distances and extinctions taken from the literature. For the parameters (distance and extinction) we use those derived using methods as free from PMS isochrone fitting as is possible in each case, as we are attempting to compare PMS ages. Once the sequences are adjusted a selection of sequences are taken as fiducial clusters, these are objects which generally have oft confirmed ages (within the literature) or accurate independent of PMS isochrone ages. To best apply relative ages for each cluster the fiducials must be chosen to adequately sample the CMD space. Using this method we have been able to generate an age sequence for our selected clusters which is as follows. The youngest groups can be collated into three sets of similar ages. The youngest set is the ONC, NGC6530 and IC5146 (nominally 1 Myrs); next Cep OB3b, NGC2362, λ Ori and NGC2264 (nominally 3 Myrs); and finally σ Ori and IC348 (nominally 4-5 Myrs). With the older groups the relative ages are much less robust, however they are ordered thus: NGC7160 (~10Myrs), h and χ Per (~13Myrs), NGC1960 (~16Myrs) and NGC2547 (~35Myrs).The empirical isochrones and relative age studies of Mayne et al (2007) give two key insights into stellar chronology and secular evolution. First, when comparing the sequences in absolute colour and magnitude it became clear that the largest source of uncertainty is often the distances to the clusters. A typical uncertainty in distance modulus to a young cluster is ~0.2, although this is often exceeded. For instance the ONC has a distance modulus estimate of 8.38+/-0.37, a difference of approximately 0.4 in V0. The second insight is a feature we term the R-C gap, which is displayed in the figure at the top in the left panel for the ONC. This feature is a separation between the fully convective PMS stars gravitationally contracting along almost vertical Hayashi tracks and radiative stars on the MS. This feature has been noted before in the literature, but it's underlying physics and potential uses have not been highlighted e.g Stolte et al (2004) call this the PMS/MS transition region (they identified it in a Js, Js-Ks CMD of NGC3603). To understand the physics behind the R-C gap we refer to the figure on the right in the top panel. This figure shows mass tracks from Siess and Dufour (2000) for stars of 7, 6, 5, 4, 3, 2, 1.2, 1.0, and 0.8 Solar masses (dashed lines) and isochrones of 0.1, 1, 3 and 13 Myrs (solid lines). The red line indicates the transition in CMD space of 1 and 3 solar mass stars between 1 and 3Myrs. As can be seen from the mass tracks as a star forms a radiative core and travels along a Henyey track towards the MS it moves a relatively large distance in CMD space when compared to a star still gravitationally contracting. This is partly due to the temperature of the star increasing whilst the size remains almost constant but is exacerbated by the nature of a CMD i.e. the scale is very much smaller on the x axis as a CMD is a y vs y-x format. The particular importance of the R-C gap however is its dependence on age and independence from distance. The size of the dislocation between the PMS and MS stars changes with age, as a cluster ages the stars joining the MS are of decreasing mass and their transition point is closer to the existing MS isochrone. For a young cluster only the massive stars will be on the MS and these will evolve to it very quickly leaving a large dislocation. Irrespective of the cluster distance the gap size can be used as an age indicator. The evolution of the gap can be seen through the clusters in the figure below, first as a dislocation in the ONC (~1Myr) and in NGC2264 (~3Myrs) then as a terminus to the PMS in σ Orionis (~4Myrs) and finally as a small dislocation between the MS and PMS in h and χ Per.