Optimal Photometry
Advantage 1. Signal-to-noise.
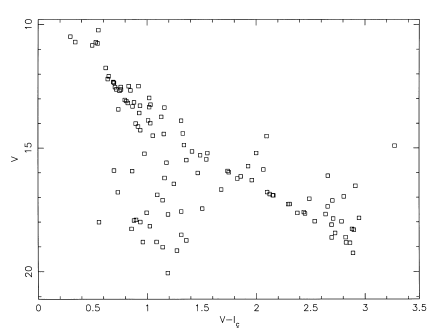
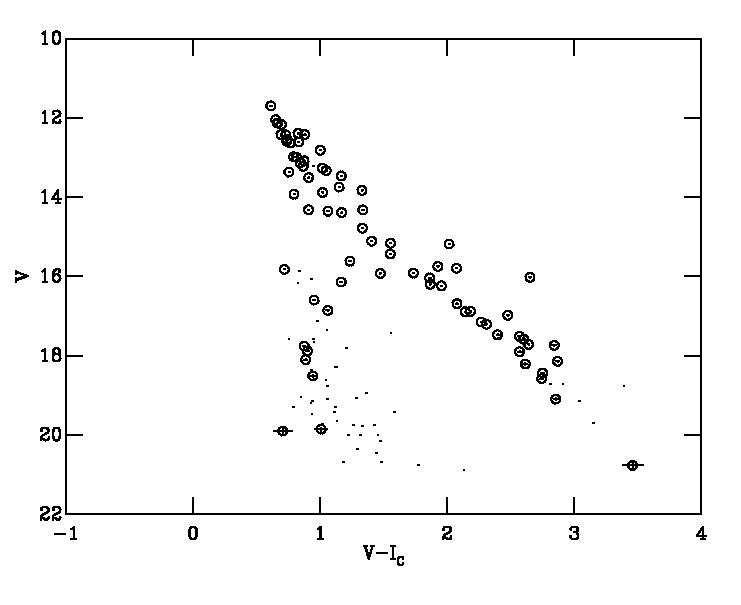
This is a colour-magnitude diagram of all the stars within X-ray error boxes from an dataset for NGC2547, reduced with aperture photometry. Below is the same dataset, reduced with optimal photometry (now the brightest stars in each X-ray error box are circled). Note how much cleaner the PMS is around V-I=2.5, and the detection of a source at V=21. We find the optimal reduction of the same data reached 0.45 magnitudes deeper for the same signal-to-noise. In principle the aperture photometry could be improved by using a smaller aperture, but as we show below, in practice this would degrade the photometry. 
Advantage 2. Robust error estimates.
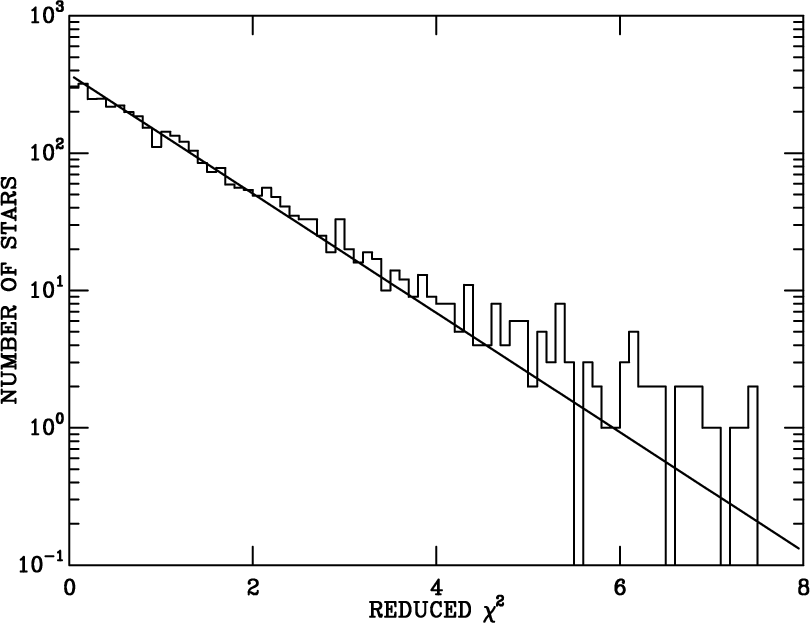
Sometimes we measure the same star in several different images. This gives us the opportunity to check that our error model is correct, by calculating the chi-squared for each measurement of a star with respect to its average brightness. The resulting distribution of chi-squared is shown as the histogram in this figure, and the theoretical distribution as a line. Note that the line is not a fit to the data, there are no free parameters! The slight excess in actual chi-squared at high values is due to genuine variability. |
