The Cluster Collaboration's Photometric Catalogue Page


This page is devoted to photometric catalogues of young stellar associations and clusters we have created. The catalogues have been created using the optimal photometry algorithm described in Naylor (1998) and Naylor et al (2002). Further information is also available from Tim Naylor's optimal photometry page. The catalogues are primarily in what is called cluster format, though there are occasional variations where they are needed. Examples of Fortran which reads these files are given on our code page.

The Whole Sky

Well, not actually produced by the cluster collaboration, but various surveys are available in cluster format through the eSTAR brokering service.

IC348

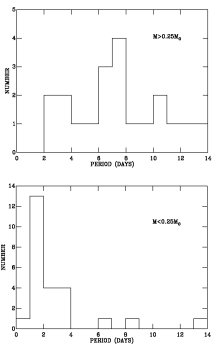
We have recently had accepted for MNRAS a paper describing our discovery of the rotation period for 32 stars in IC348. The absence of any correlation between IR excess and period in our dataset suggests that disc-locking may not be effective in spinning down the stars in IC348. We also show that the supposed correlation between IR excess and rotation period found by Herbst et al may actually be a correlation between IR excess and mass, suggesting that disc locking may not be effective in other clusters as well. However, our data do confirm the mass dependence of rotation behaviour.

We have made available a great deal of supplementary information for this dataset. First there is the catalogue of sources we observed. You can also access plots and data files for all the objects which have decent lightcurves. We obtained three lightcurves for each object, with exposure times of 2s, 30s and 300s. Rather than presenting all these, we have chosen the best one for the source in question. For the objects with periods, we've chosen the lightcurves from which the period was determined, with three exceptions. In the cases of stars 21, 55 and 147 we chose the 30s lightcurves as they contained data from more nights than the 300s ones, and thus make a more convincing case that the period is real. The lightcurve, periodogram, folded lightcurve and finding chart can be accessed via the catalogue of objects for which we derived periods. For those objects where we failed to find a credible period we normally present the lightcurve with the highest signal-to-noise and more than 50 data points. However, in the cases of stars 79 and 135 there were many more data points in the 30s lightcurves we present than the 300s we would otherwise have chosen. These lightcurves, along with periodograms and finding charts are available via the catalogue of objects where we couldn't find a period.
NGC2547

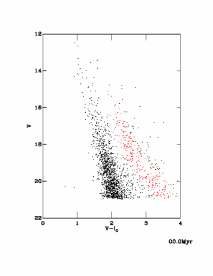
In Naylor et al (2002) we derived an age for this cluster of 20-35Myr, and determined a mass function down to 0.1 Solar masses. For the paper we created two main catalogues for this cluster. There is the table of cross identifications with Claria (1982) published as part of the original paper (Table 2), with a small correction from Francois Ochsenbein of Strasbourg (the star at 08 10 46.62 -49 17 31.53 is Claria number 55). There is a deep survey (Table 3), a shallower, but wider area survey (Table 4), and the combination of these (Table 5). Extracted from the deep catalogue are tables of members of the cluster derived using either the D'Antona & Mazzitelli (1997) isochrones (Table 6). or the Siess (2000) isochrones (Table 7). All these catalogues are in cluster format, but the members catalogues have four additional columns, described here. And, as you reach for you fibre spectrographs to make follow-up observations, we wish you the best of luck, as long as you read the warnings.

The above work relied on the X-ray catalogue of Jeffries and Tolley (1998), which is given here for convenience in cluster format.

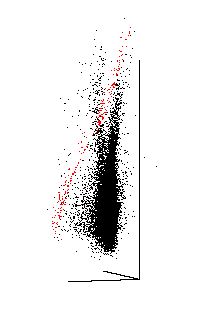
NGC2547, the movie. An animated gif or mpeg file which shows V vs B-V vs V-I from the combined catalogue. Our membership selection is shown in red.

We have also shown that this cluster is mass segregated (Littlefair et al 2003), based on the wide survey presented in Naylor et al (2002). To do this we created a list of members from the wide survey, which is available as Table 1.

Our latest results are a mass function down to 0.05 Solar masses (Jeffries et al (2004), also available in lower resolution format as astro-ph). For the paper we created an RIZ catalogue (Table A1), and a catalogues of members derived from both the Baraffe et al (2002) and the D'Antona & Mazzitelli (1997) isochrones (Tables A2 and A3, respectively). The files are in cluster format, and there is also an additional set of explanatory notes.

We are also in the process of deriving a revised age for this cluster using our new tau-squared fitting scheme, for which our PPV poster gives a preview.

Cepheus OB3

In Naylor & Fabian (1999) we discovered the low-mass stars in Cep OB3b using ROSAT X-ray observations. Our catalogue of X-ray sources is now available via our catalogue server, which has the advantage it will give you finding charts as well. Note that the first "colour" is actually the radius of the X-ray error circle (7" for the HRI, 14" for the PSPC).

In Pozzo et al (2003) we describe the discovery of the pre-main-sequence in this association. For reasons described in the paper, we'd like to revise the astrometry before releasing this catalogue. In the mean time, try this animation. We've simply taken the photometry of one of our fields, placed the PMS stars (shown in red) on PMS tracks, and then evolved the system forward 20 Myr. Notice how a very broad ``age spread'' tightens up as the association gets older.

We also present a colour-magnitude diagram for this association in Ben Burningham's paper on variability in pre-main-sequences (also available in its PPV and thesis versions) and in a preliminary version of Stuart Littlefair's rotational study of this association, (also presented at PPV).

Collinder 121

In the paper Burningham et al (2003) we describe our use of XMM-Newton (Table 2) and ROSAT (Table 3) data, along with SuperCosmos proper motions to identify the pre-main sequence (Table 4) in a VI catalogue of Cr 121 produced using these algorithms (Table 1). Those stars that were de-selected on the basis of proper motions are given in Table 5. By fitting isochrones of D'Antona and Mazzitelli (1997) to the PMS, and considering the density of PMS stars, their age spread and the higher mass members of groups along this sightline, we confirm the results of Eggen (1981) and Kaltcheva (2000) that Cr 121 is a compact, young cluster at a distance of about 1 kpc. We argue that the group idendified by de Zeeuw et al (1999) as Cr 121 at a distance of 592 pc should be called CMa OB2 (after Eggen (1981)). Note that Table 2 and Table 3 are not in cluster format. See the headers of the tables for a description. This paper also formed part of Ben's thesis.

Sigma Orionis

We have a programme to study the sigma Orionis subgroup of the Orion OB1b association. Oliviera et al (2002) used 2MASS near-IR data to investigate disks around low-mass PMS stars and brown dwarfs in this region, finding that very few possess disks.

Kenyon et al (2004) use spectroscopy of LiI, H-alpha and NaI lines to assess membership, binarity and accretion rates across a photometrically selected sample of 76 objects. They confirm many objects as members, and conclude that contamination of photometric samples by non-members runs at less than 30%. Here we have the tables of members, non-members and uncertain membership. These catalogues are in cluster format, and give I, R-I, radial velocities and LiI and NaI equivalent widths.

Burningham et al (2004) extend the assesment of the validity of photometric selections by investigating how many members would be excluded by such methods, using radial velocities to assess membership. They confirm the result of Kenyon et al (2004) with respect to contamination, and further find that photometric selection techniques are efficient, excluding very few bona-fide group members. The spectra used for this investigation are available here.

Finally Ben Burningham used data on this group to assess the effect of variability on pre-main-sequence CMDs. His paper is available either in its full form, or that presented at PPV. These last two papers also formed part of Ben's thesis.

Gamma Velorum

Some time ago we published a paper, describing the discovery of a lower-mass stars around this Wolf-Rayet star, using ROSAT data. At the time were were concerned as to whether this represented an real over density of PMS stars or not. Fortunately there were similar ROSAT observations of a nearby field at similar galactic latitude (IX Vel) which we could use as an offset field. In his thesis Ben Burningham shows that the density of PMS stars in the offset field is much lower than in the gamma Vel field, supporting the idea there is a real "cluster" around gamma Vel. Ben's optical catalogue is available here. Also available are the catalogues of ROSAT X-ray sources, optical counterparts to ROSAT sources and X-ray selected PMS candidates. Details of how optical counterparts for X-ray sources were identified may be found in chapter 2 of Ben's thesis.

Other Papers

Using the Sloan i filter to construct Cousins V-I

Testing the Catalogues

The Collaboration

These catalogues are the result of a collaboration between teams within the Exeter Astrophysics Group led by Tim Naylor, and the Keele Astrophysics Group led by Rob Jeffries. The contributors to the currently available catalogues are Ben Burningham, Tina Devey, Mike Kenyon, Stuart Littlefair, Joana Oliveira, Monica Pozzo (now at Imperial), Simon Thompson and Ed Totten.