|
In some of our work we have used the Sloan i filter in preference to
Cousins I, to cut down the night sky fringing.
We have, however, tied this back to the Landolt standards, to produce
a V-I colour.
There are already papers which compare the Sloan system to the Cousins
system, where both have been calibrated using their "natural" standards
(
Fukugita et al,
Smith et al), but nothing which uses a mixed system such as ours.
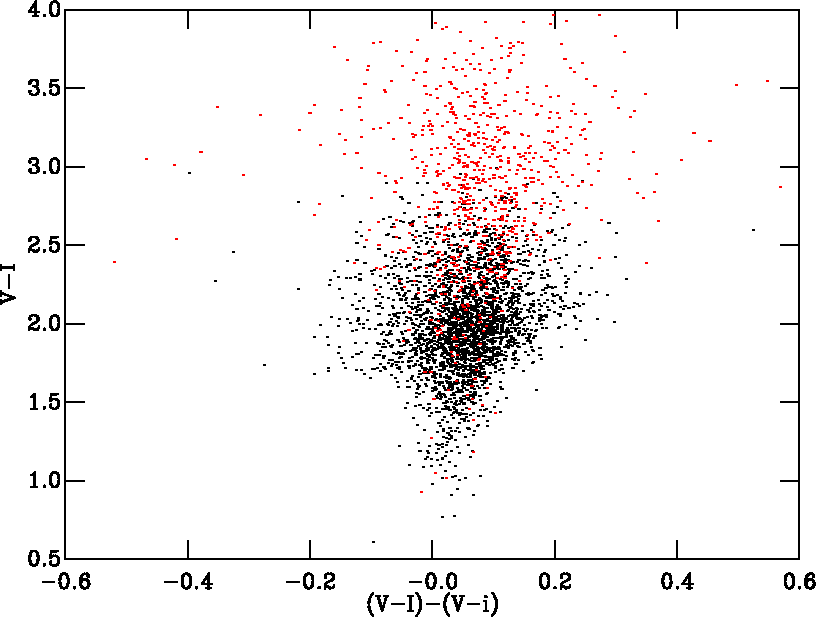
Our concerns were that there is a relatively large colour term in our
transformations (~1.2, rather than 1.0), and there might be
a systematic deviation with colour.
To examine this was have compared the V-I data we obtained for Cep
OB3b in Pozzo
et al (2003) with a Cousins I filter, to the newer data used in
Burningham et al 2005, which was obtained using a Sloan i filter,
and which for this work we calibrated to give V-I.
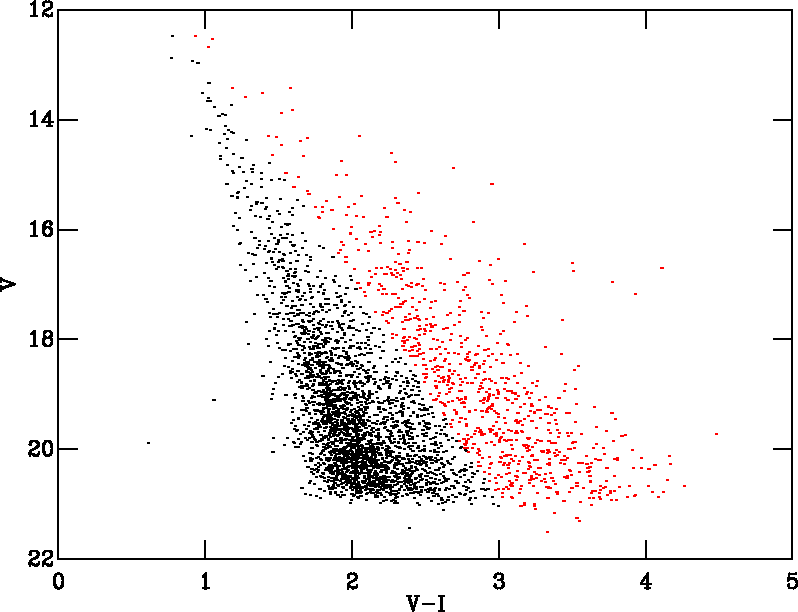
The colour-magnitude diagram on the left shows the stars in
common between the two datasets, with a photometrically defined
pre-main-sequence in red.
|