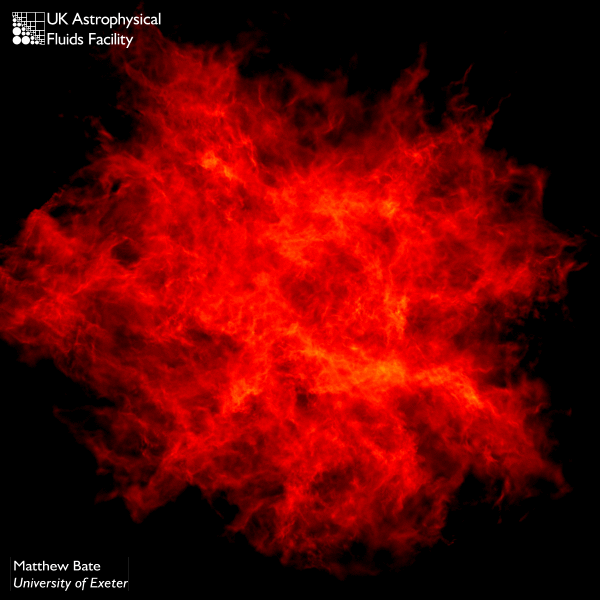
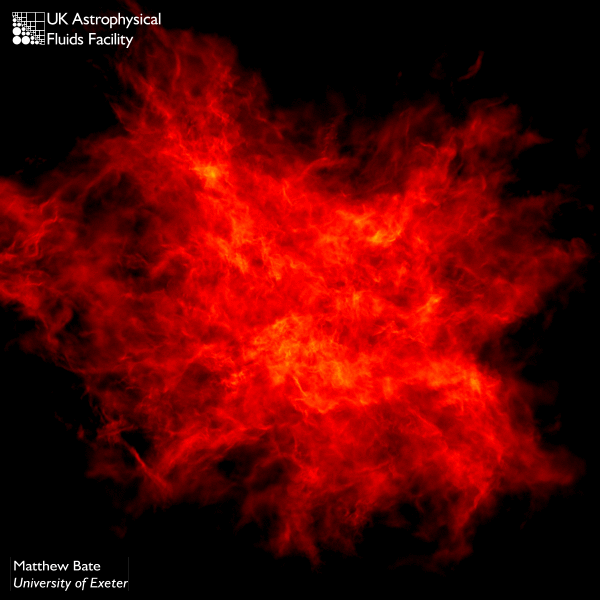
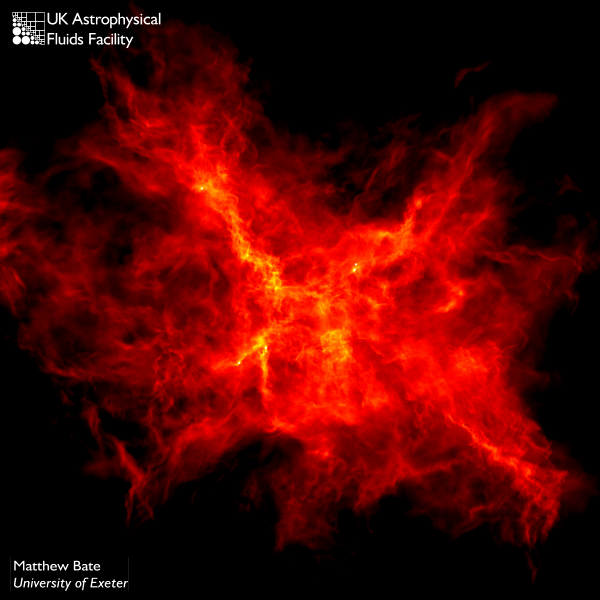
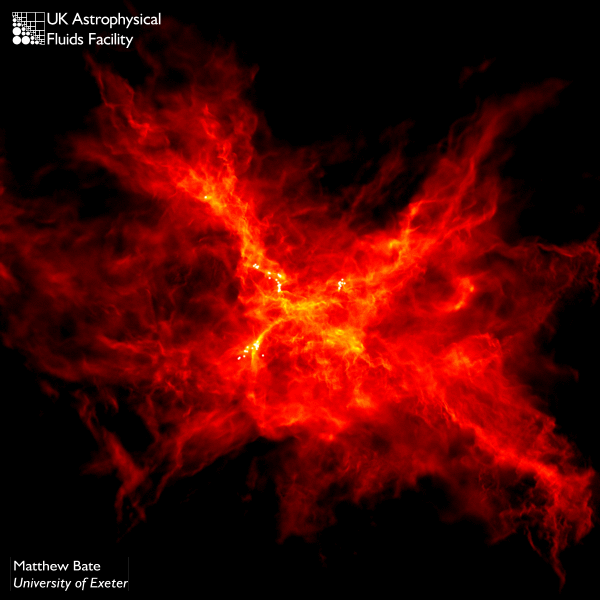
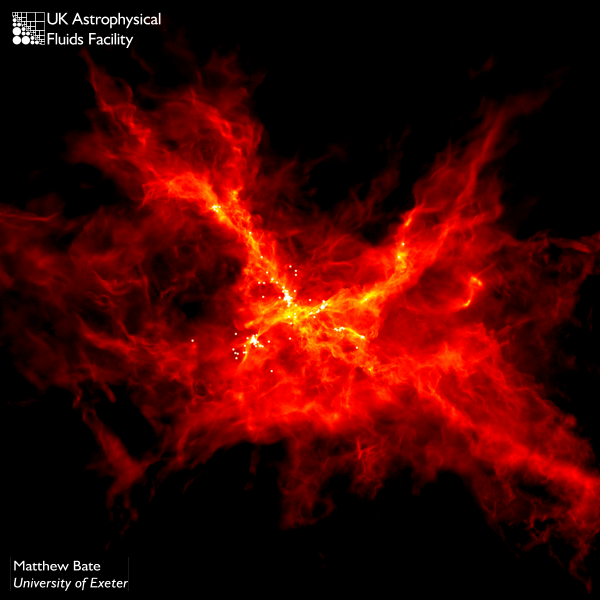
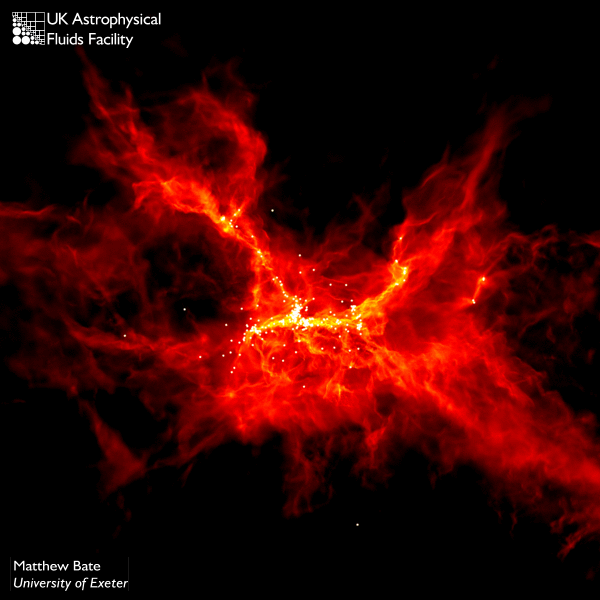
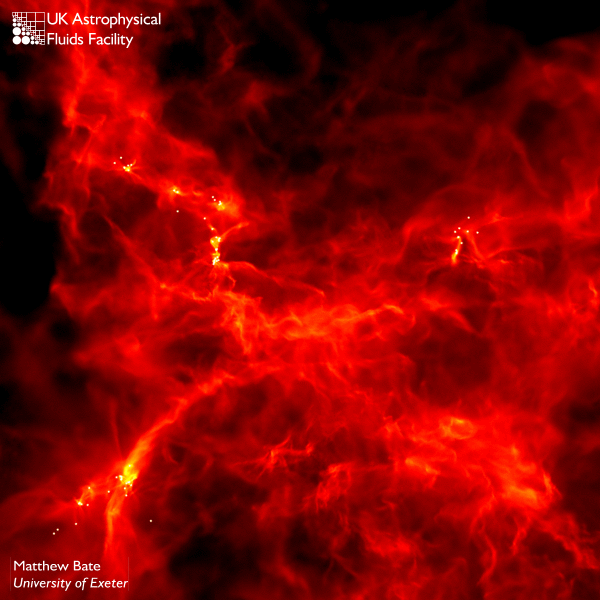
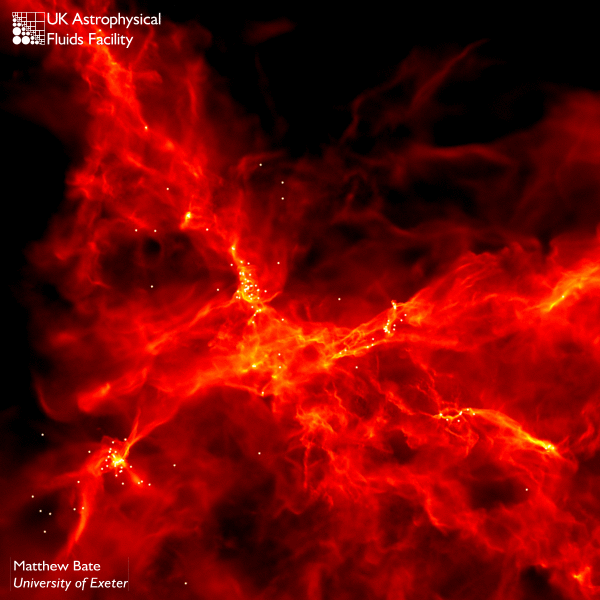
Large Star Cluster Formation in 3DMatthew R. Bate This calculation takes my star cluster calculations to a new level, modelling the collapse and fragmentation of a 500 solar mass cloud (10 times more massive than my previous calculations). The calculation produces a cluster containing more than 1250 stars and brown dwarfs to allow comparison with clusters such as the Orion Trapezium Cluster. The initial conditions were identical to those in the original calculation, but the cloud was more massive and larger in radius. Refereed Scientific Papers
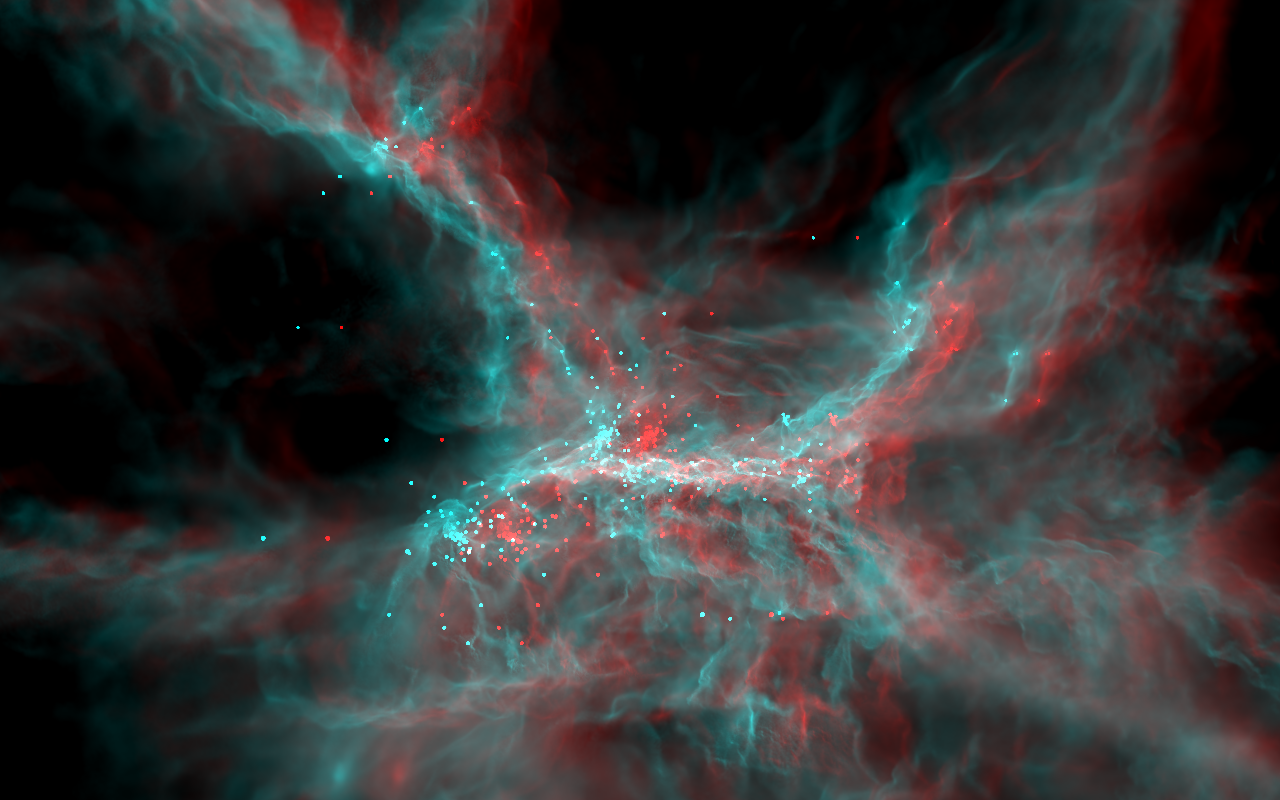
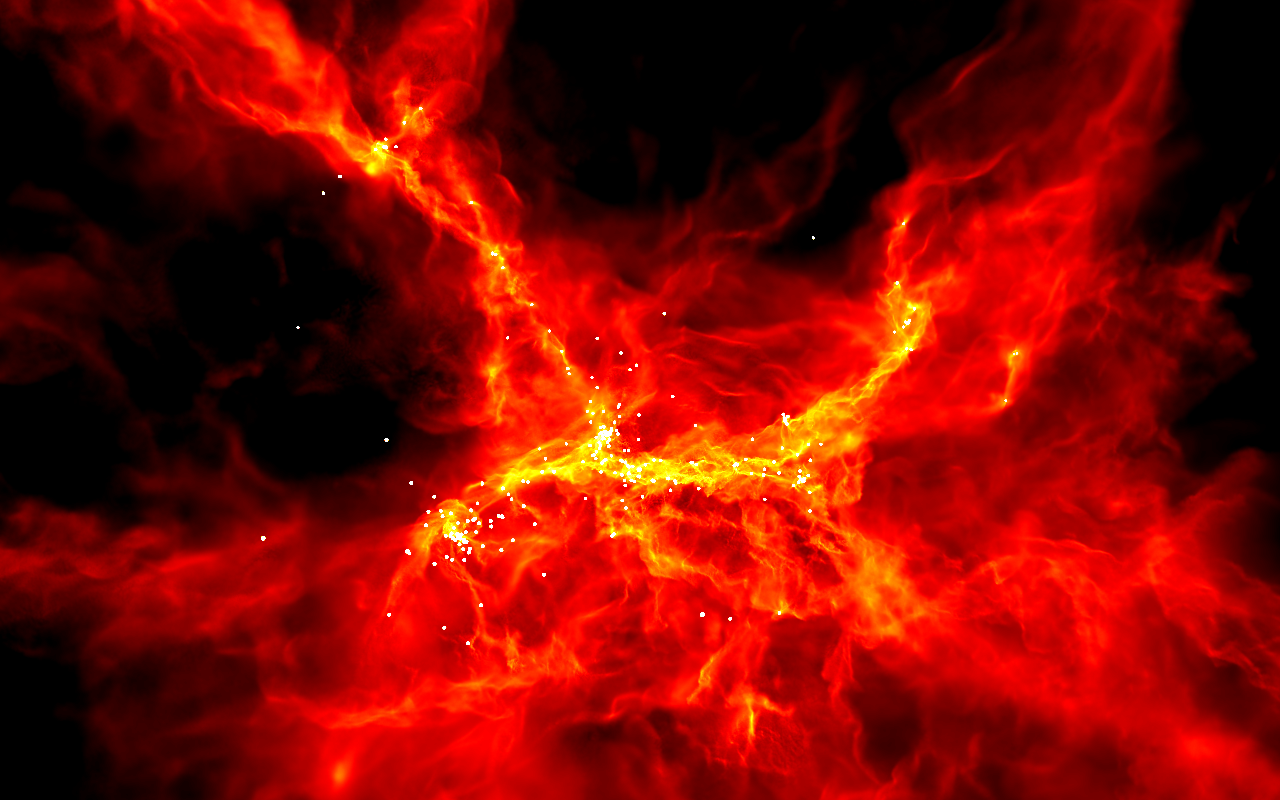
"Stellar, brown dwarf, and multiple star properties from hydrodynamical simulations of star cluster formation" AnimationsSimulation & visualisation by Matthew Bate, University of Exeter unless stated otherwise. There are two versions of the movie. One is a 3-D animation of the calculation. It should be viewed through red/cyan, red/green, or red/blue glasses. The second version is identical except for the colour scheme. This uses my typical red-yellow-white colour scheme to visualise the column density through the star-forming cloud.
Copyright: The material on this page is the property of Matthew Bate. Any of my pictures and animations may be used freely for non-profit purposes (such as during scientific talks) as long as appropriate credit is given wherever they appear. Permission must be obtained from me before using them for any other purpose (e.g. pictures for publication in books).
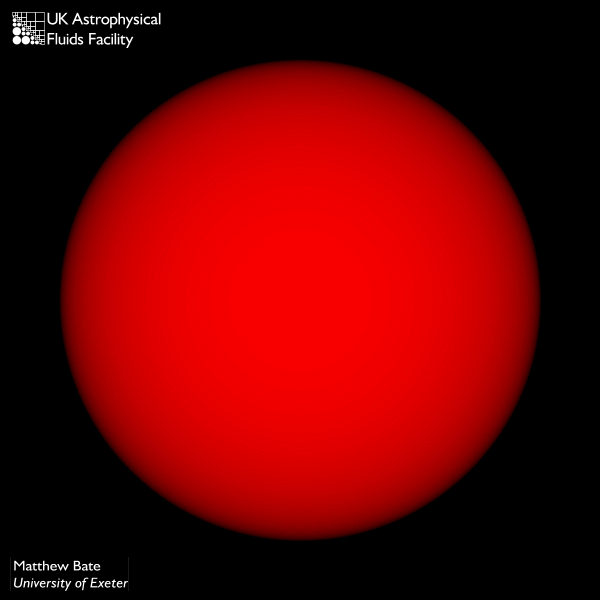
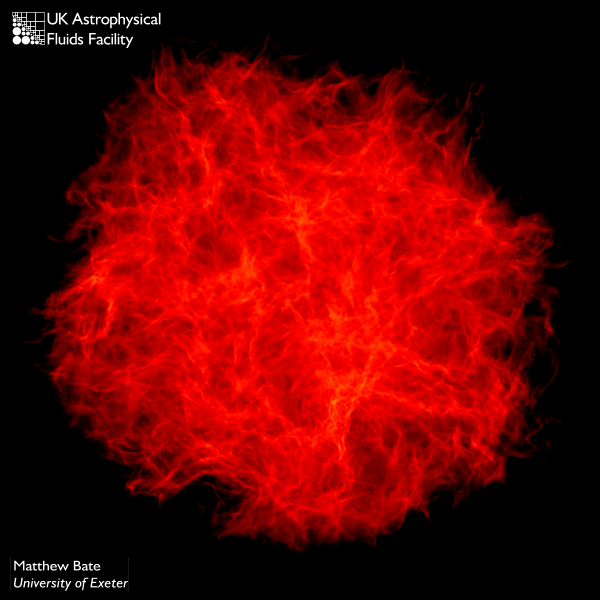
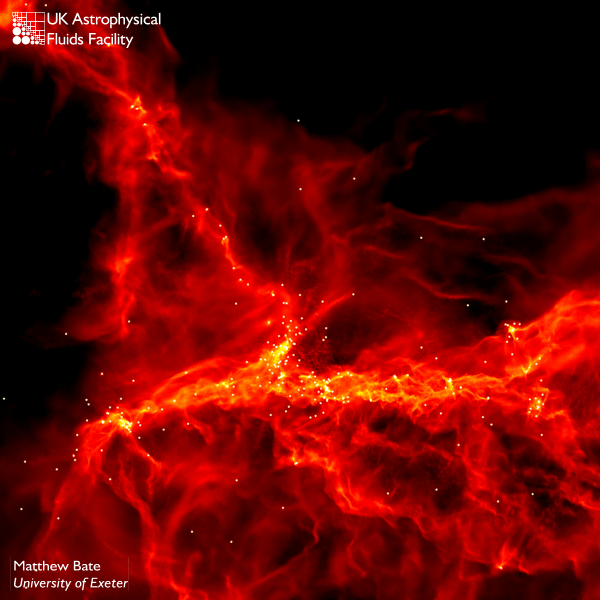
Notes on formats: Technical DetailsThe calculation models the collapse and fragmentation of a 500 solar mass molecular cloud that is 0.8 pc in diameter (approximately 2.6 light-years). At the initial temperature of 10 K with a mean molecular weight of 2.46, this results in an thermal Jeans mass of 1 solar mass. The free-fall time of the cloud is 190,000 years and the simulation covers 285,000 years. The cloud is given an initial supersonic `turbulent' velocity field in the same manner as Ostriker, Stone & Gammie (2001). We generate a divergence-free random Gaussian velocity field with a power spectrum P(k) \propto k-4, where k is the wave-number. In three-dimensions, this results in a velocity dispersion that varies with distance, lambda, as sigma(lambda) \propto lambda1/2 in agreement with the observed Larson scaling relations for molecular clouds (Larson 1981). This power spectrum is slighly steeper than the Kolmogorov spectrum, P(k)\propto k11/3. Rather, it matches the amplitude scaling of Burgers supersonic turbulence associated with an ensemble of shocks (but differs from Burgers turbulence in that the initial phases are uncorrelated). The calculation was performed using a parallel three-dimensional smoothed particle hydrodynamics (SPH) code with 35 million particles on the United Kingdom Astrophysical Fluids Facility (UKAFF). It took approximately 100,000 CPU hours running on up to 16 processors. The SPH code was parallelised using OpenMP by M. Bate. The code uses sink particles (Bate, Bonnell & Price 1995) to model condensed objects (i.e. the stars and brown dwarfs). Sink particles are point masses that accrete bound gas that comes within a specified radius of them. This accretion radius is to set 5 AU. Binary systems are followed to separations as small as 1 AU. High Resolution Still Images and Commentary
High resolution, unannotated (1800x1800 pixel) versions that are suitable for publication are available on request by emailing Matthew Bate at: mbate @ astro.ex.ac.uk Click on the images below to view medium resolution, annotated (600x600 pixel) versions. Copyright: Matthew Bate, University of Exeter.
| |||||||||||||||||||||||||||||||||||||||||||||||||||||||||