Evolution
of Young Planets
Introduction
There are two outstanding issues that
one seeks to investigate by studying the evolution of a planetary core embedded
in a circumstellar disk. The first regards the process of
planet's migration that determines the final orbital
distance from the star and, ultimately, the planet's survival.
The second is the
process of planetary accretion that governs the
growth and therefore the final mass of the planet.
The combination of the timescales over which these two phenomena occur is
likely to constrain the formation timescale of the planet itself.
The discussion that follows is based on results obtained with
fully three-dimensional high-resolution hydrodynamical
simulations of circumstellar disks hosting planets of different masses.
Gravitational Torques and Planetary Migration
The gravitational action of a forming
planet forces the circumstellar disk material to assume a characteristic
configuration. This depends on how and where the perturbing waves
launched by the planet are absorbed by the surrounding matter. The typical
density patterns that arise from this interaction process can be seen in the
two images
below. These were obtained by performing a 3D simulation of a disk containing
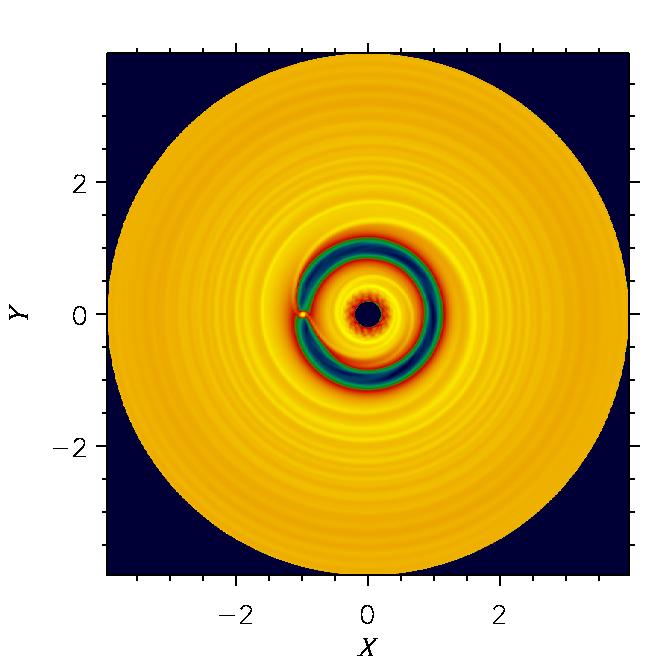
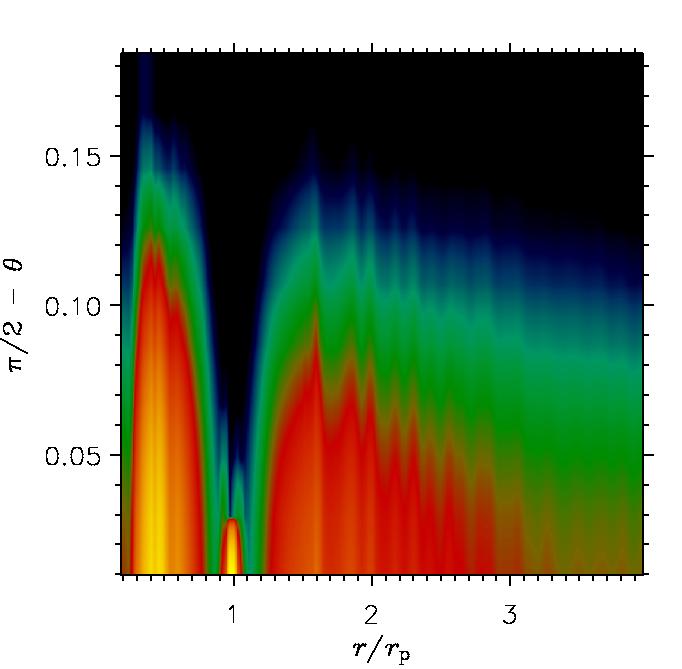
a 2 Jupiter mass (MJ) planet. The figure on the left shows the
surface density of the disk whereas the one on the right displays a vertical
cut of the density distribution through the planet.
[Click on the images to enlarge].
| Surface Density |
Vertical Density Cut |
 |
 |
Yet, gravitational perturbations induced by the planet trigger the response
of the disk material that exerts an equal force onto the planet.
Since perturbations are non-axisymmetric, there is a net force acting on the
planet which translates into a net gravitational torque, as illustrated below.
[Click on the figures to enlarge].
|
Radial Torque Distribution |
 |
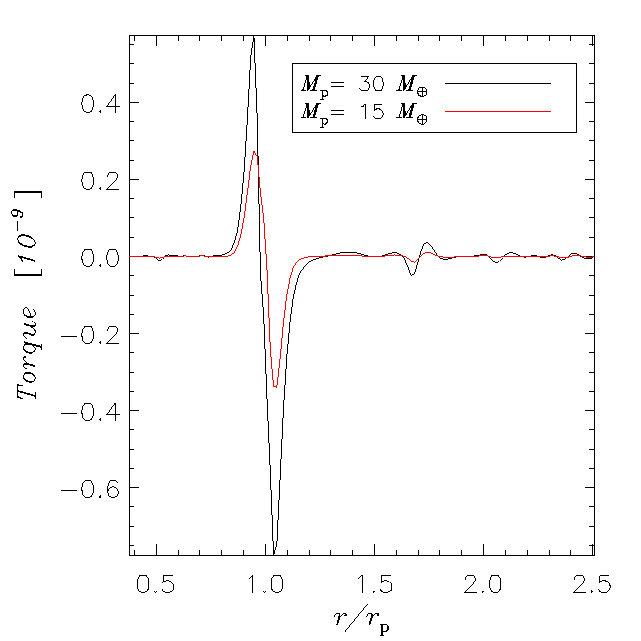 |
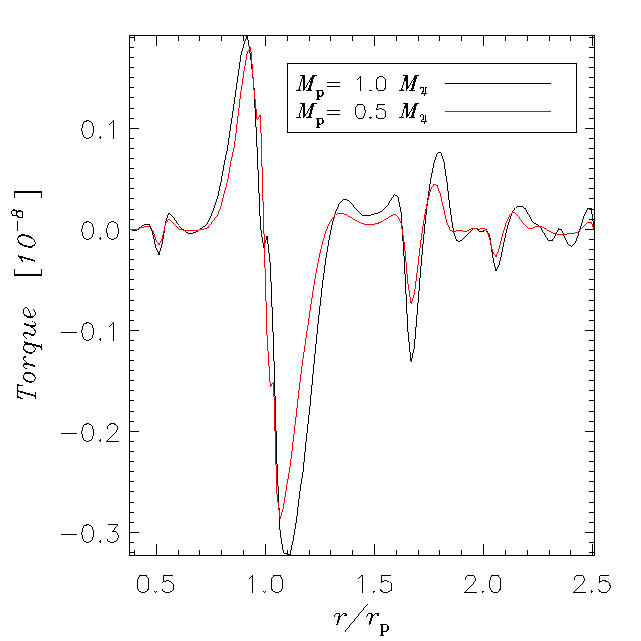
These plots show the torque exerted on the planet by each disk ring
as function of its radial position. The larger
the disturbance caused by the planet (i.e., the larger its mass), the stronger
the response of the disk is, as can be seen in the panels above.
If a net torque is exerted on the planet then its orbital angular momentum
(i.e., the semi-major axis of the orbit)
either increases or decreases, depending on the sign of the net torque.
The variation of the orbital distance due to the exchange of angular momentum
is called planet's migration.
As also hinted by the torque distributions displayed above, the net torque is
negative and this turns out to be often the case.
| Migration Rates |
The magnitude of the net torque is related to the mass of
the perturber, as indicated by the figure below. The
inverse of the migration timescale is plotted for a wide
range of planet's masses.
This quantity is proportional to the magnitude
of the net torque acting on the planet.
|
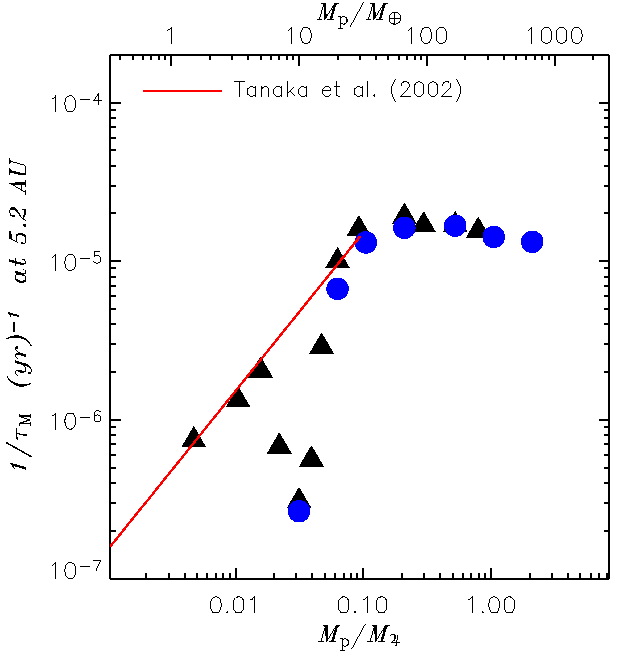 |
The flat part rightward
of 50 Earth masses, is usually referred to as
Type II migration
regime and it corresponds to the presence of a well developed
gap along the orbit of the planet.
Toward lower masses, according to analytical
theories the migration should scale linearly with the
planetary mass (Type I migration).
Numerical data shown in the figure agree only partially
with such prediction due to the onset of non-linear effects.
[Click on the figure to enlarge].
|
Planetary Accretion
The rate at which a planet grows is determined by the amount of matter
available in the surrounding region and by the strength of its gravitational
field. On one hand, Jupiter-sized objects generate a deep potential well along
with a wide gap, therefore the mean density is fairly low and so is
the accretion rate. On the other hand, Earth mass
objects have a weak gravitational field hence, although the background density
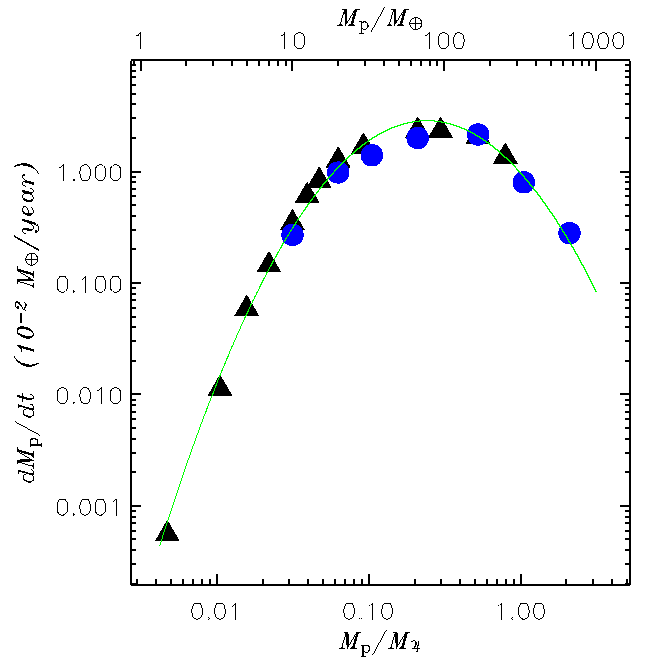
can be rather high, they also accretion at very low rates. As indicated by the
figures below, the maximum of the
accretion rate is reached around a Saturn mass (0.3 MJ), when the gravitational field is strong enough yet the gap is not too deep and wide.
[Click on the figures to enlarge].
| Accretion Rates |
Growth Timescale |
 |
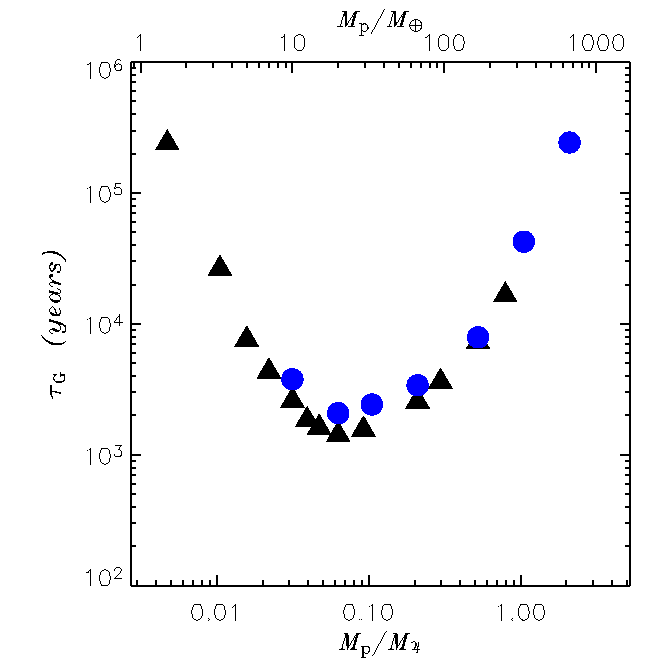 |
The symbols with different color in the figures above refer to models where
the structure of the planet was
accounted for in different manners. The green line in the left panel
represents a fit to the data. The growth timescale indicates the time
that it takes for the mass of the planet to become 2.7 times as large.
|