2016 November Nikolov et al. 2016, ApJ in press
arXiv: 161001186N
Radial Velocity Eclipse Mapping of Exoplanets
Abstract: We present transmission spectroscopy of the warm Saturn-mass exoplanet WASP-39b made with the Very Large Telescope (VLT) FOcal Reducer and Spectrograph (FORS2) across the wavelength range 411-810 nm. The transit depth is measured with a typical precision of 240 parts per million (ppm) in wavelength bins of 10 nm on a V=12.1 magnitude star. We detect the sodium absorption feature (3.2 sigma) and find evidence of potassium. The ground-based transmission spectrum is consistent with Hubble Space Telescope (HST) optical spectroscopy, supporting the interpretation that WASP-39b has a largely clear atmosphere. Our results demonstrate the great potential of the recently upgraded FORS2 spectrograph for optical transmission spectroscopy, with which we obtained HST-quality light curves from the ground.
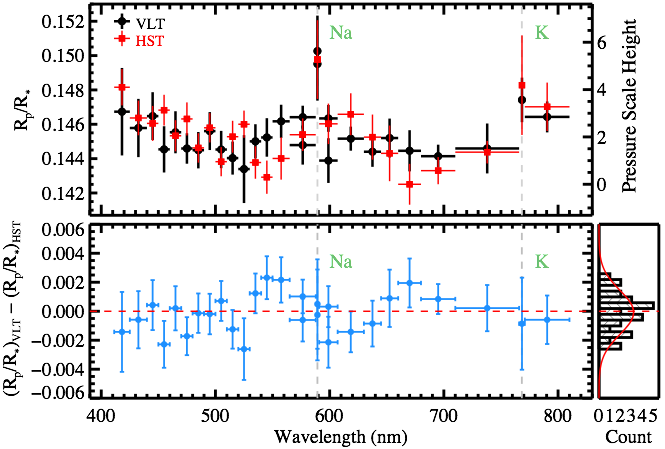
Figure 4. Comparison between the WASP-39b transmission spectrum from VLT/FORS2 and HST/STIS. The top panel displays the individual measurements with their uncertainties. The lower panels display the radius differences, assuming the uncertainty of the FORS2 and STIS measurements. The residual distribution is shown on the right along with the best-fit Gaussian, which is indicated with the red continuos line.
Figure 5. Comparison of the FORS2 transmission spectrum (dots and boxes refer to GRIS600B and GRIS600RI, respectively) to models (continuous lines).


... out is the first paper of a comparative followup of clear and cloudy exoplanet atmospheres with the recently upgraded VLT FORS2.

2015 June Nikolov & Sainsbury-Martinez 2015, ApJ, 808, 57
arXiv: 1506.04901
Abstract: Planetary rotation rates and obliquities provide information regarding the history of planet formation, but have not yet been measured for evolved extrasolar planets. Here we investigate the theoretical and observational perspective of the Rossiter–McLaughlin effect during secondary eclipse (RMse) ingress and egress for transiting exoplanets. Near secondary eclipse, when the planet passes behind the parent star, the star sequentially obscures light from the approaching and receding parts of the rotating planetary surface. The temporal block of light emerging from the approaching (blueshifted) or receding (redshifted) parts of the planet causes a temporal distortion in the planet’s spectral line profiles resulting in an anomaly in the planet’s radial velocity curve. We demonstrate that the shape and the ratio of the ingress-to-egress radial velocity amplitudes depends on the planetary rotational rate, axial tilt, and impact factor (i.e., sky-projected planet spin–orbital alignment). In addition, line asymmetries originating from different layers in the atmosphere of the planet could provide information regarding zonal atmospheric winds and constraints on the hot spot shape for giant irradiated exoplanets. The effect is expected to be most-pronounced at near-infrared wavelengths, where the planet-to-star contrasts are large. We create synthetic near-infrared, high- dispersion spectroscopic data and demonstrate how the sky-projected spin axis orientation and equatorial velocity of the planet can be estimated. We conclude that the RMse effect could be a powerful method to measure exoplanet spins.


2015 January Nikolov et al. 2015, MNRAS, 447, 463
arXiv: 1411.4567
... HST reveals the haziest hot Jupiter atmosphere (WASP-6b)
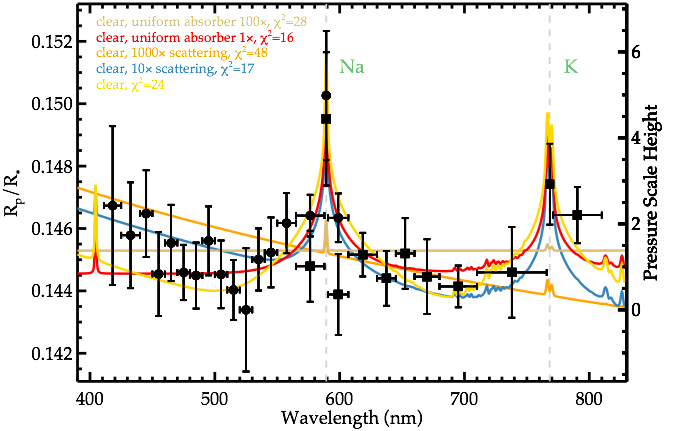
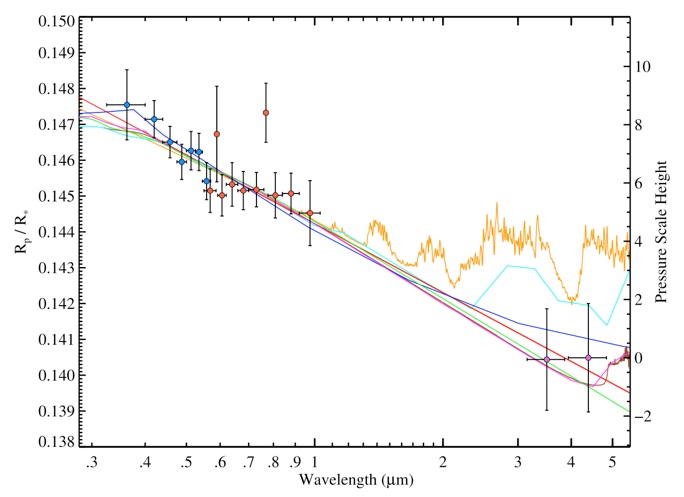
Abstract: We report Hubble Space Telescope (HST) optical to near-infrared transmission spectroscopy of the hot Jupiter WASP-6b, measured with the Space Telescope Imaging Spectrograph (STIS) and Spitzer's InfraRed Array Camera (IRAC). The resulting spectrum covers the range 0.29−4.5μm. We find evidence for modest stellar activity of WASP-6b and take it into account in the transmission spectrum. The overall main characteristic of the spectrum is an increasing radius as a function of decreasing wavelength corresponding to a change of Δ(Rp/R∗)=0.0071 from 0.33 to 4.5μm. The spectrum suggests an effective extinction cross-section with a power law of index consistent with Rayleigh scattering, with temperatures of 973±144 K at the planetary terminator. We compare the transmission spectrum with hot-Jupiter atmospheric models including condensate-free and aerosol-dominated models incorporating Mie theory. While none of the clear-atmosphere models is found to be in good agreement with the data, we find that the complete spectrum can be described by models that include significant opacity from aerosols including Fe-poor Mg2SiO4, MgSiO3, KCl and Na2S dust condensates. WASP-6b is the second planet after HD189733b which has equilibrium temperatures near ∼1200 K and shows prominent atmospheric scattering in the optical.
HST hot-Jupiter transmission spectral survey: Haze in the atmosphere of WASP-6b
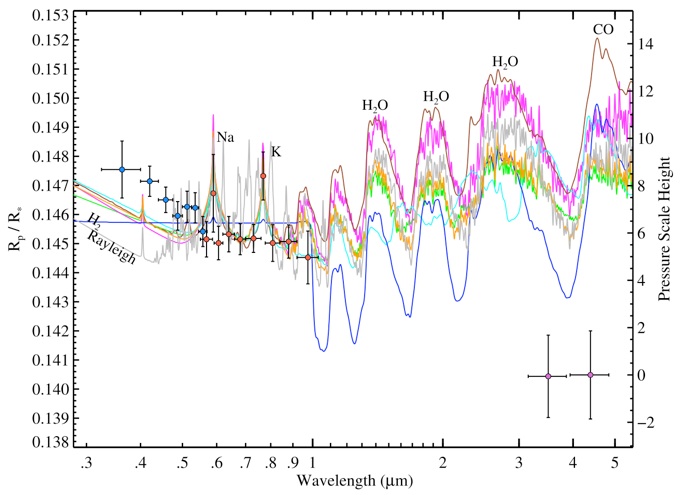
Figure 12. Broad-band transmission spectrum of WASP-6b compared (without the sodium and potassium measurements) to seven different aerosol models including: Rayleigh scattering (red), Mie scattering KCl (green), MgSiO3 (magenta),Fe-poor Mg2SiO4 (brown), a model with enhanced Rayleigh scattering component with a cross-section 103 times that of H2, Fortney.noTiO-EnhancedRayleigh (orange), Na2S (blue) and Titan tholin (cyan).
Figure 11. WASP-6b transmission spectrum compared to seven different cloud-free atmosphere models listed in Table 4, including Burrows-Dayside1200K-3 ×solar (brown), Burrows-Isoth.1200K- high-CO (cyan), Burrows-Isoth.1200K-ExtraAbsorber (blue), Fortney-Isoth.1000K (green), Fortney-Isoth.1500K-noTiO/VO (magenta), Fortney- PlanetAveraged1200K (orange) and Fortney-Isoth.1500K-withTiO/VO (grey). All these models hardly reproduce the two Spitzer measurements. Prominent absorption features are labelled.
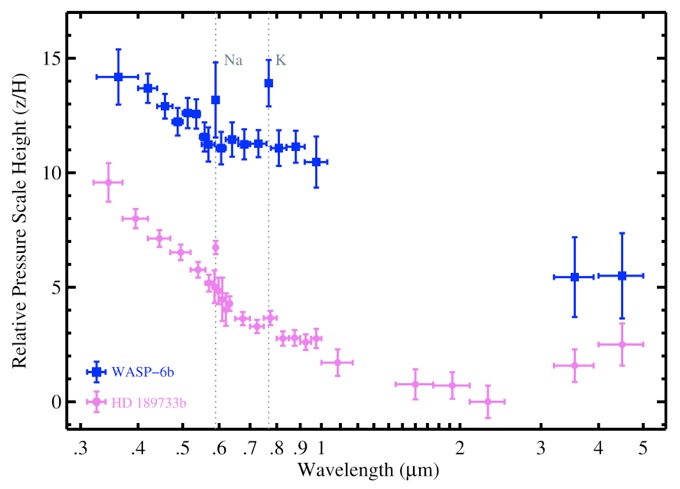
Figure 15. Transmission spectrum of WASP-6b (blue) and HD 189733b (magenta), taken from Pont et al. (2013).
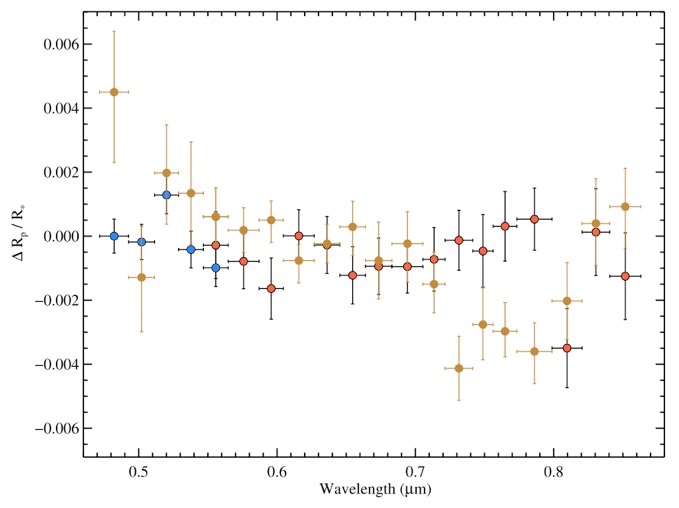
Figure 14. Comparison between the WASP-6b transmission spectrum from HST STIS and Magellan IMACS (blue, red and brown dots, respectively).


2014 October Nikolov et al. 2014, MNRAS, 437, 46
arXiv: 1310.0083
... HST detects sodium and water in the atmosphere of HAT-P-1b, but no potassium
Abstract: We present an optical to near-infrared transmission spectrum of the hot Jupiter HAT-P-1b, based on HST observations, covering the spectral regime from 0.29 to 1.027{\mu}m with STIS, which is coupled with a recent WFC3 transit (1.087 to 1.687{\mu}m). We derive refined physical parameters of the HAT-P-1 system, including an improved orbital ephemeris. The transmission spectrum shows a strong absorption signature shortward of 0.55{\mu}m, with a strong blueward slope into the near-ultraviolet. We detect atmospheric sodium absorption at a 3.3{\sigma} significance level, but find no evidence for the potassium feature. The red data implies a marginally flat spectrum with a tentative absorption enhancement at wavelength longer than ~0.85{\mu}m. The STIS and WFC3 spectra differ significantly in absolute radius level (4.3 +/- 1.6 pressure scale heights), implying strong optical absorption in the atmosphere of HAT-P-1b. The optical to near-infrared difference cannot be explained by stellar activity, as simultaneous stellar activity monitoring of the G0V HAT-P-1b host star and its identical companion show no significant activity that could explain the result. We compare the complete STIS and WFC3 transmission spectrum with theoretical atmospheric mod- els which include haze, sodium and an extra optical absorber. We find that both an optical absorber and a super-solar sodium to water abundance ratio might be a scenario explaining the HAT-P-1b observations. Our results suggest that strong optical absorbers may be a dominant atmospheric feature in some hot Jupiter exoplanets.
Hubble Space Telescope hot Jupiter transmission spectral survey: a detection of Na and strong optical absorption in HAT-P-1b
Figure 11. Top panels: the observational transmission spectrum (in terms of Rp/R∗ obtained from light-curve fits, shown with dots and vertical error bars; horizontal errors indicate the band widths used to obtain light curves) around the sodium and potassium features (left- and right-hand panels, respectively), compared to theoretical cloud free models [shown with green and purple continuous lines for Fortney et al. (2008, 2010) and Burrows et al. (2010) and Howe & Burrows (2012), respectively, described in detail in Section 4] and the related radius predictions (boxes and triangles), both shifted from each other and the data for clarity. Lower panels: differential-transit light curves of 30 and 75 Å bands, centered on the sodium and potassium doublets, respectively, to that of a reference composed from the average of a blue and red band, bracketing each feature. Differential limb darkening curves are indicated with continuous lines.

VLT FORS2 Comparative Transmission Spectroscopy:
Detection of Na in the Atmosphere of WASP-39b
from the Ground
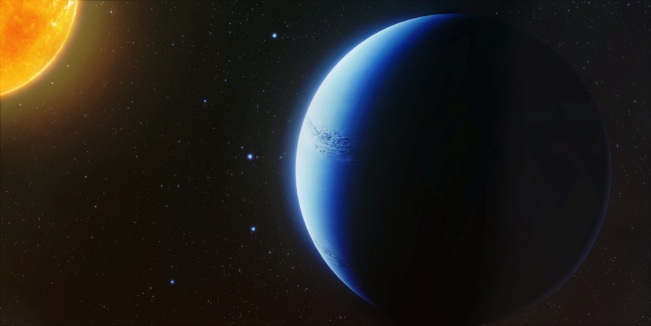
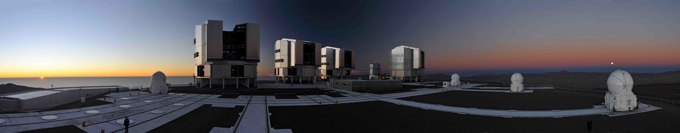
G. Hüdepohl/ESO
... out is a new method which could provide the first measurements of prograde and retrograde exoplanet spins.
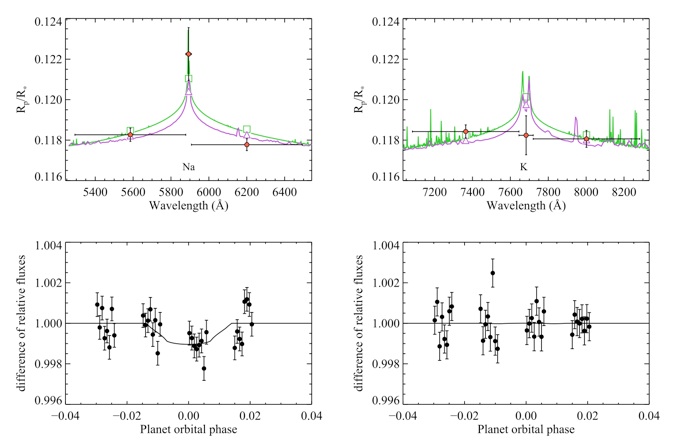
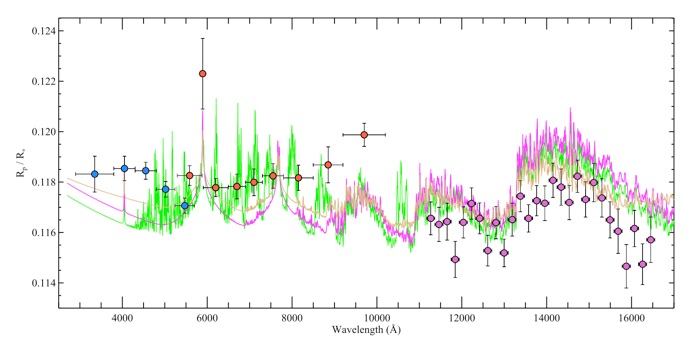
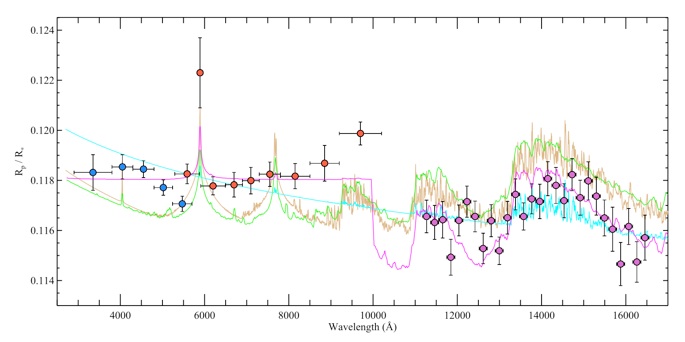
Figure 13. HST transmission spectrum (blue, red and purple dots refer to the STIS G430L, G750L and WFC3 data, respectively) compared to atmospheric models (continuous lines) generated for the HAT-P-1 system. Fortney et al. (2008, 2010) isothermal hydrostatic uniform abundance models with an equilibrium temperature 1000 K (brown line) and 1500 K (green line with TiO and VO; purple line: without TiO and VO). Horizontal and vertical error bars indicate the spectral bin sizes and the Rp/R∗ uncertainties, respectively.
Figure 14. Same as Fig. 13, but for the models assuming specific pressure–temperature profiles and isothermal models with additional adjustments. Green line: dayside model from Burrows et al. (2010) and Howe & Burrows (2012) at solar metallicity without TiO/VO. Brown line: dayside model from Fortney et al. (2008, 2010) without TiO/VO. Purple line: an isothermal model of Burrows et al. (2010) with an ‘extra absorber’ at altitude with an opacity of 0.03 cm2 g−1 from 0.4 to 1.0 μm. Cyan line: isothermal model from Fortney et al. (2008, 2010) with enhanced (factor of 103) Rayleigh scattering. Horizontal and vertical error bars indicate the spectral bin sizes and the Rp/R∗ uncertainties, respectively.


2013 March Nikolov et al. 2013,A&A, 553, 26
arXiv: 1303.4565
... new result for WASP-23b with GROND @ MPG/ESO 2p2
Refined physical properties and g',r',i',z',J,H,K transmission spectrum of WASP-23b from the ground
Abstract: Multi-band observations of planetary transits using the telescope defocus technique may yield high-quality light curves suitable for refining the physical properties of exoplanets even with small or medium size telescopes. Such observations can be used to construct a broad-band transmission spectrum of transiting planets and search for the presence of strong absorbers. We have thoroughly characterized the orbital ephemeris and physical properties of the transiting planet and host star in the WASP-23b system, constructed a broad-band transmission spectrum of WASP-23b and performed a comparative analysis with theoretical models of hot Jupiters. We observed a complete transit of WASP-23b in seven bands simultaneously, using the GROND instrument on the MPG/ESO 2.2m telescope at La Silla Observatory and telescope defocussing. The optical data were taken in the Sloan g',r',i' and z' bands. The resulting light curves are of high quality, with a root-mean-square scatter of the residual as low as 330ppm in the z'-band, with a cadence of 90s. Near-infrared data were obtained in the JHK bands. We performed MCMC analysis of our photometry plus existing radial velocity data to refine measurements of the ephemeris and physical properties of the WASP-23. We constructed a broad-band transmission spectrum of WASP-23b and compared it with a theoretical transmission spectrum of a Hot Jupiter. We measured the central transit time with a precision about 8s. From this and earlier observations we obtain an orbital period of P=2.9444300+/-0.0000011d. Our analysis also yielded a larger radius and mass for the planet (Rp=1.067+0.045-0.038 RJup and, Mp=0.917+0.040-0.039MJup). The transmission spectrum is marginally flat, given the limited precision of the measurements for the planet radius and poor spectral resolution of the data.
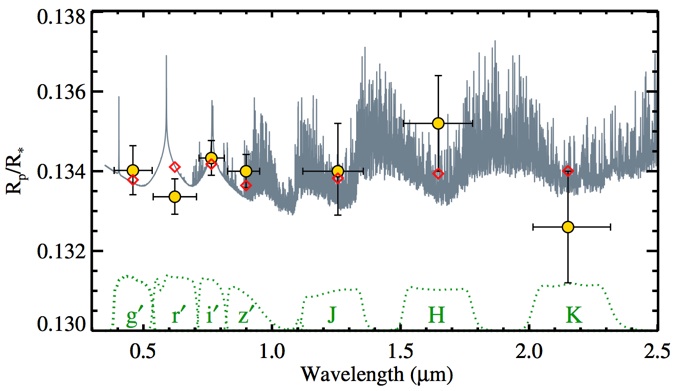
Fig. 4. Radius variation (measured with Rp/R∗ and indicated with yellow disks with error bars) of WASP-23b in the seven optical to NIR passbands, compared to a synthetic transmission spectrum based on a planet-wide pressure-temperature profile (grey continuous line). The open red diamonds indicate the expected theoretical values, integrated over GROND’s filter curves. The latter are displayed as dotted lines at the origin of the graph.
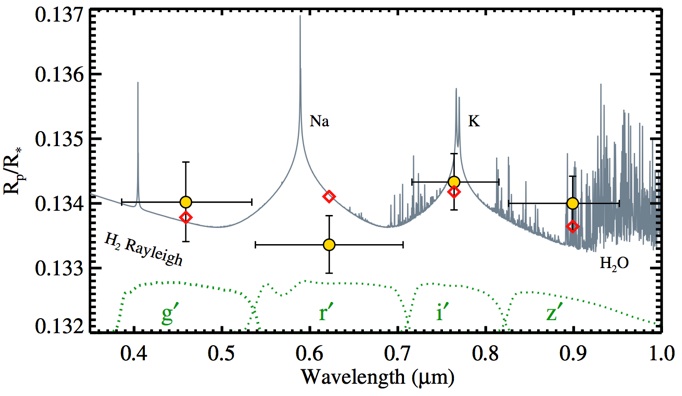
Fig.5. Same as Fig. 4, but displaying a closer view of the radius variation in the optical bands.
Extended version of Figure 2 of Nikolov & Sainsbury-Martinez 2015. Plotted is the radial velocity anomaly due to the Rossiter-McLaughlin effect during secondary eclipse assuming non-synchronized Jupiter-like planet (and rotation) on 20 d orbit around a Sun-like star.
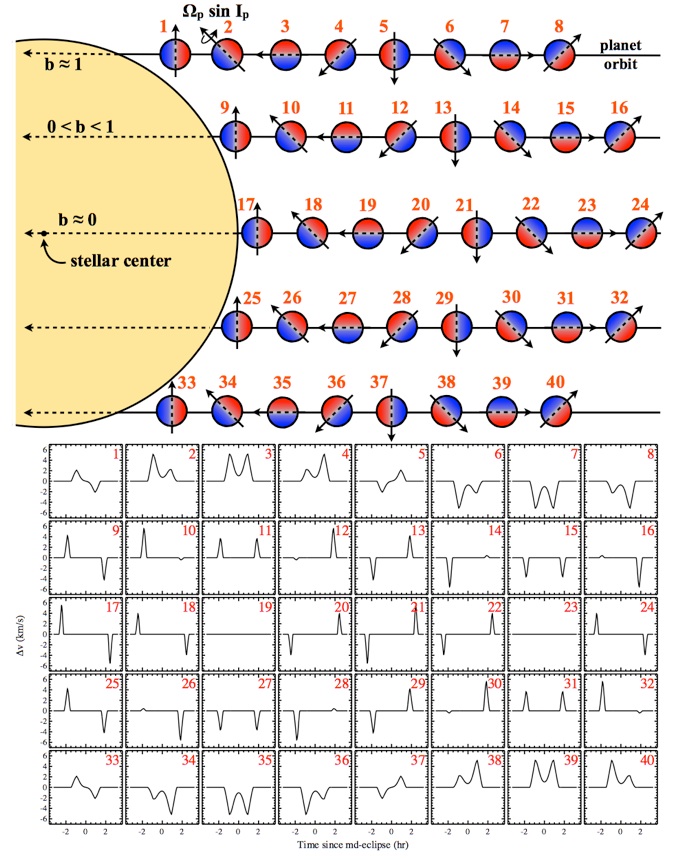
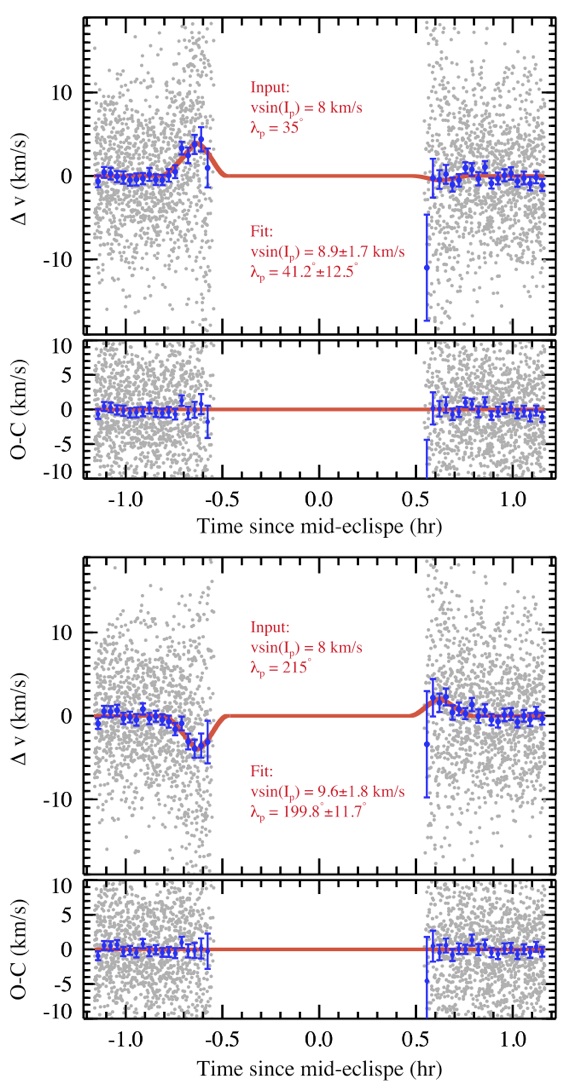
Figure 3. Mock data (gray dots) illustrating the RMse effect, best-fit radial velocity curve (red lines), and radial velocity residuals. Upper and lower pair panels illustrate the cases of a WASP-19 system, assuming tidally synchronized prograde and a retrograde rotating planet, respectively. The blue symbols indicate the binned radial velocity curves by 2 minutes.
Figure 3. Mock data (gray dots) illustrating the RMse effect, best-fit radial velocity curve (red lines), and radial velocity residuals. Upper and lower pair panels illustrate the cases of a WASP-19 system, assuming tidally synchronized prograde and a retrograde rotating planet, respectively. The blue symbols indicate the binned radial velocity curves by 2 minutes.
2017 November Nikolov et al. 2017, MNRAS in press
arXiv: 1711.00859

... out is a new paper from our HST Panchromatic survey.

Hubble PanCET: An isothermal day-side atmosphere for the bloated gas-giant HAT-P-32Ab
Abstract: We present a thermal emission spectrum of the bloated hot Jupiter HAT-P-32Ab from a single eclipse observation made in spatial scan mode with the Wide Field Camera 3 (WFC3) aboard the Hubble Space Telescope (HST). The spectrum covers the wavelength regime from 1.123 to 1.644 microns which is binned into 14 eclipse depths measured to an averaged precision of 104 parts-per million. The spectrum is unaffected by a dilution from the close M-dwarf companion HAT-P-32B, which was fully resolved. We complemented our spectrum with literature results and performed a comparative forward and retrieval analysis with the 1D radiative-convective ATMO model. Assuming solar abundance of the planet atmosphere, we find that the measured spectrum can best be explained by the spectrum of a blackbody isothermal atmosphere with Tp = 1995 +/- 17K, but can equally-well be described by a spectrum with modest thermal inversion. The retrieved spectrum suggests emission from VO at the WFC3 wavelengths and no evidence of the 1.4 micron water feature. The emission models with temperature profiles decreasing with height are rejected at a high confidence. An isothermal or inverted spectrum can imply a clear atmosphere with an absorber, a dusty cloud deck or a combination of both. We find that the planet can have continuum of values for the albedo and recirculation, ranging from high albedo and poor recirculation to low albedo and efficient recirculation. Optical spectroscopy of the planet's day-side or thermal emission phase curves can potentially resolve the current albedo with recirculation degeneracy.
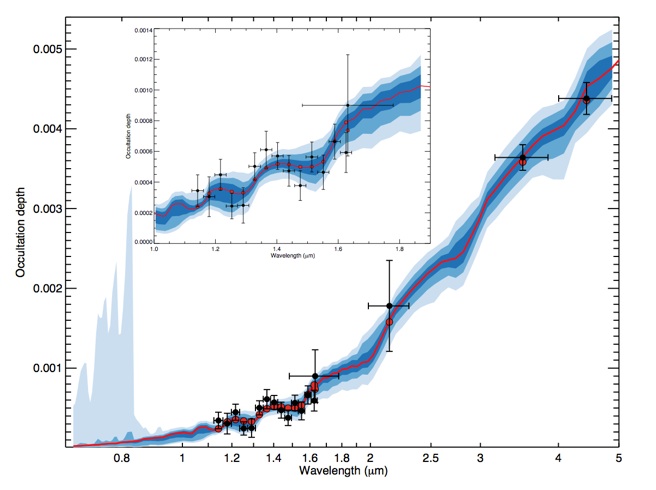
Figure 4. Emission spectrum of HAT-P-32Ab (dots with 1σ uncertainties) with model emission spectra (lines) binned to the resolution of the data (red dots), obtained during the retrieval analysis. The continuous red line shows the best-fit retrieved model along with 1-, 2- and 3-σ confidence levels. A zoom around the WFC3 is shown in the top left corner.
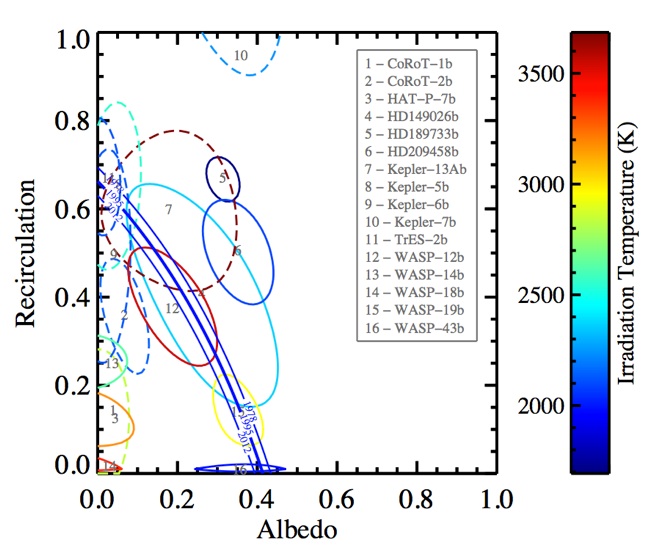
Figure 6. Constraints on the planetary albedo and recirculation efficiency of HAT-P-32Ab (blue curve with 1-σ confidence regions) compared to measurements for other sixteen gas-giants (closed regions). The main reason for the degeneracy strip instead of a constrained ’island’ for HAT-P-32Ab is in the limited constraining power of infrared eclipse observations alone. The degeneracy has been resolved for the sixteen exoplanets by combining infrared with optical occultations. Composite 1σ confidence regions are shown with the horizontal axis measuring different quantities: Geometric albedo at visible wavelengths for exoplanets with optical eclipse observations-only (dashed lines) and Bond albedo for thermal observation planets (solid lines). The colour bar indicates irradiation temperature, where the red and purple colours correspond to warmer and cooler temperatures, respectively.
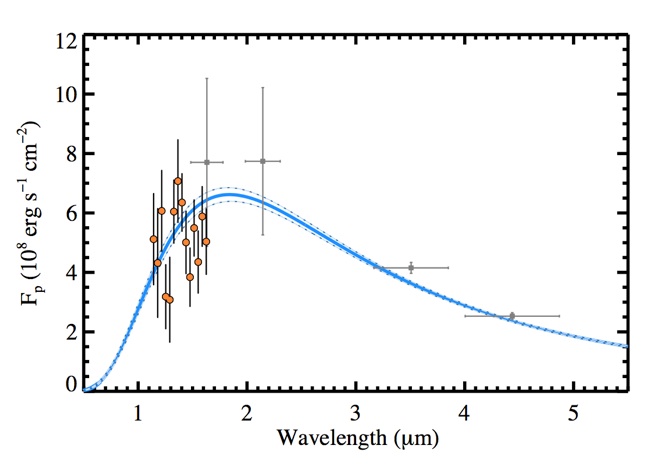
Figure 7. Planet thermal emission spectrum of HAT-P-32Ab (orange and grey dots refer to the WFC3 and WIRC+IRAC ob- servations, respectively) along with the best-fit blackbody curve (Tp = 1995 ± 17 K) and 1σ uncertainty (blue lines).
2018 May Nikolov et al. 2018, Nature
arXiv:1806.06089

... a cloud-free atmosphere for WASP-96b with VLT FORS2
first result from a large VLT program

An absolute sodium abundance for a cloud-free
'hot Saturn' exoplanet
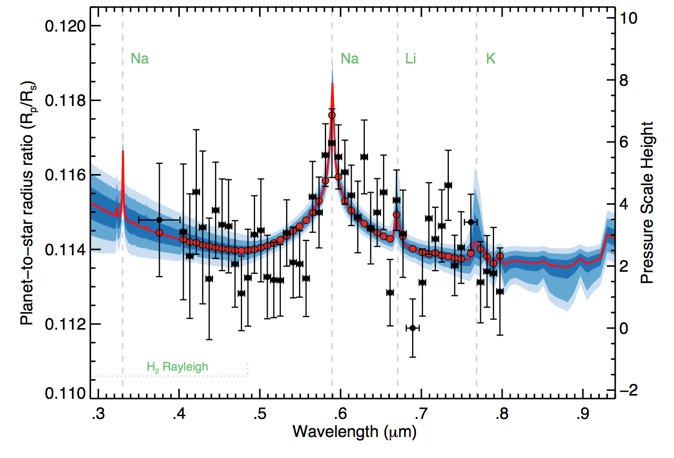
Abstract: Broad absorption signatures from alkali metals, such as the sodium (Na i) and potassium (K i) resonance doublets, have long been predicted in the optical atmospheric spectra of cloud-free irradiated gas giant exoplanets. However, observations have revealed only the narrow cores of these features rather than the full pressure-broadened profiles. Cloud and haze opacity at the day-night planetary terminator are considered to be responsible for obscuring the absorption-line wings, which hinders constraints on absolute atmospheric abundances. Here we report an optical transmission spectrum for the ‘hot Saturn’ exoplanet WASP-96b obtained with the Very Large Telescope, which exhibits the complete pressure-broadened profile of the sodium absorption feature. The spectrum is in excellent agreement with cloud-free, solar-abundance models assuming chemical equilibrium. We are able to measure a precise, absolute sodium abundance of log \epsilon_Na = 6.9^{+0.6}_{-0.4} and use it as a proxy for the planet’s atmospheric metallicity relative to the solar value (Zp/Zsun = 2.3^{+8.9}_{-1.7}. This result is consistent with the mass–metallicity trend observed for Solar System planets and exoplanets.
Figure 1. Transmission spectrum of WASP-96b, adapted from Fig. 1 of Nikolov et al. (2018). Comparison of the FORS2 observations (black dots with 1σ vertical error bars; the horizontal bars indicate spectral bin widths) with the best-fit model obtained from a retrieval analysis (red line) binned to the data resolution (red dots), with the 1σ, 2σ and 3σ confidence intervals (dark blue to pale blue regions).
Nikolov et al. (2018, Nature)
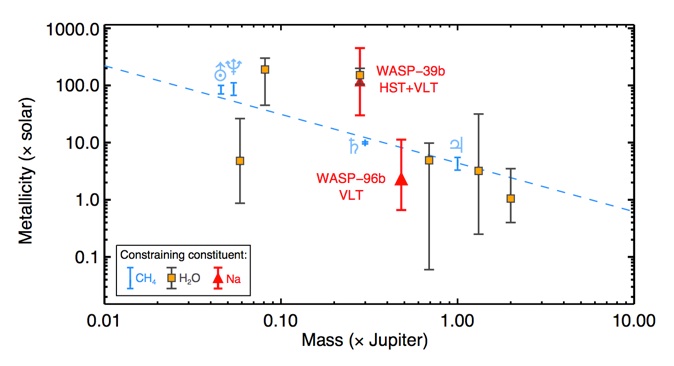
Figure 3. Mass–metallicity diagram for Solar System planets and exoplanets, adapted from Fig. 3 of Nikolov et al. (2018). Methane (CH4) and water (H2O) are the two absorbing constituents used to constrain the atmospheric metallicity of Solar System planets (blue bars) and hot gas giant exoplanets (orange squares with grey error bars), respectively. Absorption lines from atomic Na (red triangles and error bars) can provide another proxy for exoplanet atmospheric metallicity, by combining three Hubble Space Telescope (HST) and two Very Large Telescope (VLT) transits for WASP-39b. With its detected and resolved pressure-broadened Na line wings, WASP-96b is the first transiting exoplanet for which high-precision atmospheric metallicity has been constrained using data only from the ground. Each error bar corresponds to the 1σ uncertainty. The blue line indicates a fit to the Solar System gas giants (pale blue symbols indicate Solar System planets).
VLT FORS2 spectrum of WASP-96b
#------------------------------------------------------
# 1-min wavelength Angstroem
# 2-max wavelength Angstroem
# 3-RpRs
# 4-err RpRs
# 5-u_1
# 6-err u_1
# 7-u_2
#-1-----2--------3---------4-------5-------6-------7---
3500 4013 0.11479 0.00152 0.484 0.059 0.207
4013 4093 0.11447 0.00182 0.553 0.059 0.219
4093 4173 0.11382 0.00167 0.539 0.053 0.223
4173 4253 0.11554 0.00167 0.493 0.052 0.227
4253 4333 0.11459 0.00205 0.458 0.054 0.231
4333 4413 0.11321 0.00163 0.464 0.049 0.235
4413 4493 0.11505 0.00129 0.479 0.043 0.239
4493 4573 0.11466 0.00123 0.522 0.039 0.242
4573 4653 0.11462 0.00125 0.415 0.043 0.246
4653 4733 0.11361 0.00116 0.422 0.042 0.251
4733 4813 0.11282 0.00100 0.404 0.038 0.255
4813 4893 0.11324 0.00130 0.385 0.040 0.256
4893 4973 0.11440 0.00104 0.337 0.041 0.258
4973 5053 0.11451 0.00138 0.367 0.044 0.262
5053 5133 0.11326 0.00112 0.410 0.038 0.269
5133 5213 0.11318 0.00101 0.288 0.043 0.273
5213 5293 0.11317 0.00096 0.336 0.040 0.275
5293 5373 0.11444 0.00089 0.260 0.039 0.277
5373 5453 0.11365 0.00095 0.349 0.047 0.278
5453 5533 0.11361 0.00089 0.299 0.042 0.283
5533 5613 0.11322 0.00102 0.330 0.046 0.287
5613 5693 0.11541 0.00095 0.303 0.050 0.290
5693 5773 0.11499 0.00095 0.284 0.044 0.291
5773 5853 0.11653 0.00084 0.263 0.044 0.295
5853 5933 0.11685 0.00092 0.270 0.041 0.296
5933 6013 0.11648 0.00086 0.236 0.049 0.296
6013 6093 0.11607 0.00086 0.242 0.050 0.297
6093 6173 0.11545 0.00081 0.169 0.053 0.302
6173 6253 0.11487 0.00096 0.316 0.044 0.313
6253 6333 0.11648 0.00099 0.235 0.041 0.314
6333 6413 0.11457 0.00096 0.194 0.045 0.314
6413 6493 0.11499 0.00091 0.185 0.046 0.314
6493 6573 0.11553 0.00100 0.267 0.043 0.313
6573 6653 0.11284 0.00089 0.250 0.040 0.313
6653 6733 0.11532 0.00081 0.192 0.038 0.313
6733 6813 0.11442 0.00117 0.155 0.044 0.314
6813 6973 0.11189 0.00078 0.087 0.042 0.314
6973 7053 0.11311 0.00090 0.100 0.052 0.314
7053 7133 0.11483 0.00096 0.129 0.051 0.314
7133 7213 0.11428 0.00085 0.104 0.044 0.315
7213 7293 0.11463 0.00097 0.156 0.048 0.315
7293 7373 0.11572 0.00094 0.277 0.038 0.315
7373 7453 0.11357 0.00081 0.102 0.050 0.316
7453 7533 0.11405 0.00096 0.263 0.046 0.316
7533 7693 0.11473 0.00075 0.147 0.042 0.315
7693 7773 0.11312 0.00109 0.190 0.049 0.315
7773 7853 0.11341 0.00096 0.189 0.049 0.315
7853 7933 0.11336 0.00123 0.175 0.053 0.314
7933 8013 0.11287 0.00117 0.214 0.059 0.314